- NIBE Group Acquisitions
- NIBE Group Business areas
- NIBE Group Companies/Brands list
- NIBE Group contributes to sustainable energy solutions
- NIBE Group History
- NIBE Group map
- NIBE Group Movies
- NIBE Group Stories
- Drivers and trends
- NIBE Annual General Meeting and Nomination Committee
- NIBE MTN and CERT Program
- NIBE Management Philosophy
- NIBE Board of Directors
- NIBE Share
- NIBE Strategic focus areas
- NIBE Vision and targets
- Corporate-Governance-Bericht
- Calendar 2025-2026
- Financial reports
- Other Press releases
- MTN Program
- NIBE Share
- Key figures
- NIBE Group pictures
- IR Contacts
- Sustainability Governance
- Sustainability Strategy
- Value Chain
- Materiality Analysis
- E Environment information
- S Social information
- G Governance information
- Sustainability Reports and Policys
- Corporate sustainability responsibility
- NIBE Headquarter
- NIBE Climate Solutions
- NIBE Element
- NIBE Stoves
- ALL acquisitions
- Acquisitions in Nordic Countries
- Acquisitions in Europe
- Acquisitions in North Amerika, Asia
- Climate Solutions
- Element
- Stoves
- A greener Netherlands
- A stove provides peace of mind in a power cut
- Fireplaces as the main heat source
- Ice-Free Railway
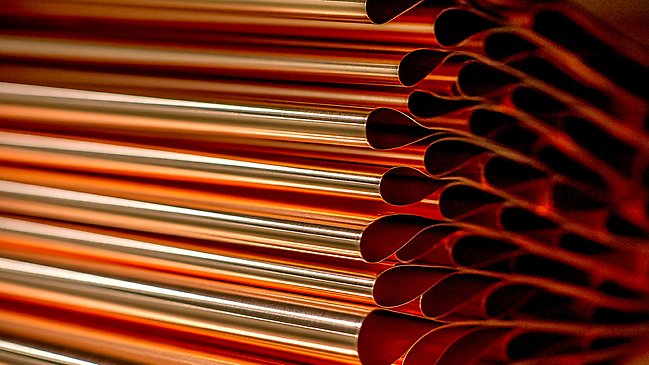
- Resistors for Braking of Electric Cars
- Secure electric power for buses in the cold
- Temperature Monitoring for Semiconductors
- We are reducing customers’ CO2 emissions
- Wind turbine blades need to be able to stay warm
- Fastigheter 40%
- Infrastruktur
- NIBE-Fastigheter 40%
- NIBE i hemmet
- NIBE- Infrastruktur
- Städte stehen
- Definitions
- Key figures
- Major shareholders
- NIBE Stories
- Growth and Expansion
- Product development and Innovation
- Responsibility
- Sustainability
- NIBE Business Principles
- NIBE Our Values
- Key areas
- E Environment information
- S Social information
- G Governance information
- E1 Climate change
- E2 Pollution
- E3 Water and marine resources
- E5 Resource use and circular economy
- EUs Taxonomy
- S1 The own workforce
- S2 Workers in the value chain
- G1 Business conduct
- G1 Business conduct in society

- NIBE GROUP
- NIBE Group Acquisitions
- NIBE Group Business areas
- NIBE Group Companies/Brands list
- NIBE Group contributes to sustainable energy solutions
- A greener Netherlands
- A stove provides peace of mind in a power cut
- Fireplaces as the main heat source
- Ice-Free Railway
- Resistors for Braking of Electric Cars
- Secure electric power for buses in the cold
- Temperature Monitoring for Semiconductors
- We are reducing customers’ CO2 emissions
- Wind turbine blades need to be able to stay warm
- NIBE Group History
- NIBE Group map
- NIBE Group Movies
- NIBE Group Stories
- GOVERNANCE
- INVESTORS
- SUSTAINABILITY
- CONTACT
- Search
Investors
Reports
Year-end report 2025
CONFIRMATION OF RECOVERY FOR THE YEAR AS A WHOLE
– ROBUST DEVELOPMENT IN THE FOURTH QUARTER
Interim report 3, 2025 (Q3)
R E C O V E R Y
C O N T I N U E S
Interim report 2, 2025 (Q1)
A quarter of continued recovery and a brighter outlook
Interim report 1, 2025 (Q1)
Continued signs of recovery despite a slightly cautious market and political turbulence
Press releases
2026-02-12
CEO Gerteric Lindquist, comments on the Year-end Report, 2025
2025-11-14
CEO Gerteric Lindquist, comments on third quarter, 2025
2025-08-25
NIBE Industrier appoints Claes Hemberg as Energy Economist of the Group
2025-08-22
CEO and MD, Gerteric Lindquist, comments on second quarter, 2025