GRI-Appendix
306 Effluents & Waste
103 - Effluents and Waste
Waste is an important topic for all our production companies and there are ongoing efforts to minimize waste generation as well as recycling more.
306-1 - Water discharge
Water discharge is considered material for a few of our production companies* from a monitoring perspective. We have chosen to ask all production companies to report their water discharge to be able to see trends and take action against negative changes. We are attempting to get data that are more reliable on water discharge.
Water discharge, cubic meters | Europe | North America | Asia and Australia | TOTAL |
|---|---|---|---|---|
To municipal water treatment plant | 144 797 | 39 902 | 60 595 | 245 294 |
To an adjacent water body | 7 204 | 0 | 46 000 | 53 204 |
To external treatment | 1268 | 0 | 500 | 1 768 |
To another organization for reuse | 0 | 0 | 0 | 0 |
Total per region | 153 269 | 39 902 | 107 095 | 300 266 |
Metal discharges to water, kg | Europe | North America | Asia and Australia | TOTAL |
|---|---|---|---|---|
Aluminum | 0 | 0 | 0 | 0 |
Copper | 0,062 | 3,86 | 0 | 3,921 |
Zinc | 0,555 | 2,505 | 0 | 3,06 |
Cadmium | 0,013 | 0,012 | 0 | 0,024 |
Lead | 0,2 | 0,022 | 0 | 0,223 |
Mercury | 0 | 0,002 | 0 | 0,002 |
Chromium | 0,061 | 0,012 | 0 | 0,002 |
Nickel | 0,111 | 0,016 | 0 | 0,127 |
Other metals | 1,49 | 0,01 | 0 | 1,502 |
Organics and nutrients to water, kg | Europe | North America | Asia and Australia | TOTAL |
|---|---|---|---|---|
Biochemical Oxygen Demand | 417 | 4 576 | 20 | 5014 |
Chemical Oxygen Demand | 2 442 | 8 519 | 40 | 11 001 |
Total Organic Carbon | 0 | 0 | 0 | 0 |
Oil and Grease | 0,02 | 599 | 0 | 599 |
Nitric nutrients | 208 | 0 | 2 | 210 |
Phosphoric nutrients | 23 | 18 | 0 | 41 |
Total solids | 3 090,02 | 13 712 | 62 | 16 864 |
306-2 - Waste by type and disposal method
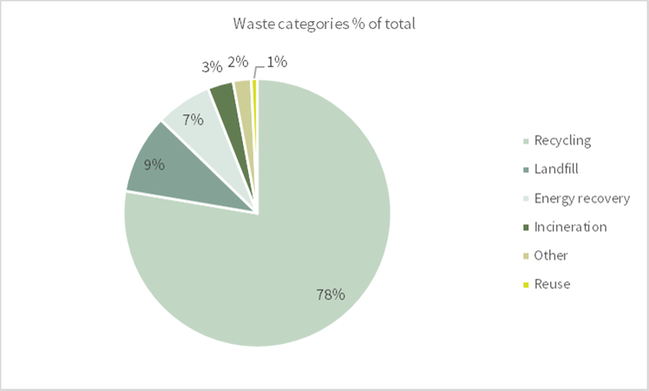
In 2017, we recycled 85 percent (85) of our waste, 11 percent (11) of which as energy recovery by means of incineration. A total of 17 390 (18 050) tons of waste were generated, 760 (1 680) tons of which were hazardous waste.
We sent 1 220 (1 360) tons to external landfill, which represents 7 percent of the total waste volume. This consists, for example, of process waste, which may contain contents of heavy metals that are too high for recycling or materials that cannot be incinerated, such as stone ceramics and composites.
Non-hazardous waste, kg | Europe | North America | Asia and Australia | TOTAL |
|---|---|---|---|---|
Reuse | 8 314 | 183 639 | 0 | 191 953 |
Recycling | 16 178 009 | 5 867 226 | 65 000 | 22 110 235 |
Recovery | 276 145 | 0 | 0 | 281 045 |
Energy recovery | 1 716 563 | 78 200 | 20 000 | 1 925 473 |
Incineration | 357 665 | 0 | 0 | 357 665 |
Landfill | 1 017 542 | 1 344 881 | 285 878 | 2 648 301 |
On-site storage | 3 100 | 20 485 | 0 | 23 585 |
Other destination | 122 713 | 25 124 | 55 590 | 203 427 |
Total | 19 680 051 | 7 519 555 | 426 468 | 28 070 941 |
Hazardous waste, kg | Europe | North America | Asia and Australia | TOTAL |
|---|---|---|---|---|
Reuse | 5 | 0 | 0 | 5 |
Recycling | 36 190 | 20 462 | 217 044 | 273 696 |
Recovery | 12 119 | 0 | 0 | 12 119 |
Energy recovery | 20 969 | 19 461 | 10 101 | 50 531 |
Incineration | 120 780 | 384 436 | 41 318 | 546 534 |
Landfill | 73 197 | 27 216 | 26 701 | 127 114 |
On-site storage | 3 001 | 569 | 0 | 3 570 |
Other destination | 388 508 | 43 020 | 1 960 | 433 488 |
Total | 654 769 | 495 164 | 297 124 | 1 464 618 |
306-3 - Number and volume of significant spills
No significant spills were reported during 2017.
306-4 - Transport of hazardous waste
Not reported.
306-5 - Water bodies affected by water discharges and/or runoff
Not reported.