GRI-Appendix
Specific Standard Disclosures
301 Materials
103 - Explanation of the material topic and its Boundary
The management approach and its components
The use of materials is an important topic within the organization, especially for our producing companies. It is also important outside the organization, as we work with to secure our products from hazardous substances and conflict minerals. It means that we have to start from the sourcing process to be able to fulfil our customers’ demands for product safety and legal compliance.
Minimizing use of materials and care for natural resources starts in our product development. Minimizing the use of materials in our products lowers not only costs for material and transportation, but also waste generation.
NIBE has increased its total use of material, but if we compare it with sales, the material intensity is lower than it used to be.
301-1 - Materials used by weight or volume
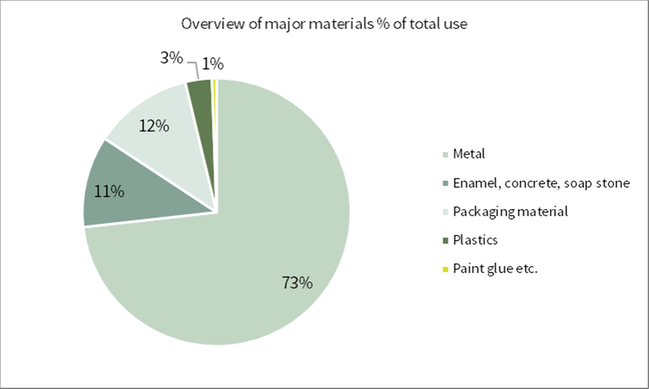
Metals such as iron, steel, copper and brass represent 73 (73) percent of our total inputs. Other inputs are stone, concrete, enamel, plastic, composite components and chemicals such as dye and glue.
In 2017, 16 496 (9 580) tons of packaging material were used, consisting of wood, board, plastic and steel.
Refrigerants used to fill our products amounted to 368,6 (139) tons. The increase in refrigerants
is due to newly acquired companies’ consumption and a slightly different reporting method.
301-2 - Recycled input materials used
Not reported.
301-3 - Reclaimed products and their packaging materials
Not reported.
302 Energy
103 - Explanation of the material topic and its Boundary
The management approach and its components
Energy use is a very important topic within the organization concerning both lowering the usage and shifting to renewable energy. Energy is also the backbone in our business strategy, as our core business is to provide the market with sustainable energy solutions.
The approach is to work internally with our own energy use and to develop products that can support a transition to a low carbon economy and less climate impact. NIBE targets are to reduce energy intensity by 30% within our own operations and to minimise the use of oil to heat our properties by 2020 (baseline 2013). Another of our target is to have at least 55% of our sales from products that are LCE classified according to FTSE's LCE[1]-index.
[1] FTSE LCE ICS ™ (Financial Times Stock Exchange-Low Carbon Economy Industrial Classification System) is a quantitative model, developed for investors to be able to evaluate companies based on their ability to adapt to a low carbon economy. The LCE data model measures the green revenues of 13,400 public companies, representing 98.5% of total global market capitalization. FTSE Russell's Green Revenues framework, based on the LCE data model, allows users to track revenues from goods, products and services that help the world to adapt to, mitigate or remediate the impact of climate change, resource depletion or environmental erosion.
302-1 - Energy consumption within the organization
NIBE total energy consumption, direct and indirect (excluding transportation), was 218,9 (167) GWh. Of this, 5,0 (3,1) GWh consists of electricity, heat and cooling we generated from solar and wind power and heat pumps.
Our indirect energy consumption, i.e. purchased electricity and district heating, amounted to 143,7 (112) GWh. Of this, 135,8 (105) GWh was electricity consumption. Almost all our purchased electricity comes from renewable sources. We have started to measure emissions from transportation and now we have comparable data for our own vehicle fleet for consumption of diesel and petrol. The consumption of petrol was 2,0 (3,2) GWh and diesel 19,7 (20,3) GWh.
302-2 - Energy consumption outside the organization
Not reported.
302-3 - Energy intensity
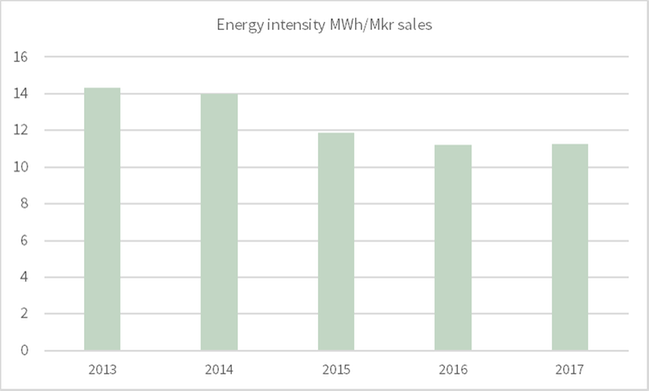
NIBE target is to reduce our energy intensity by 30% compared to 2013 before end of 2020.
302-4 - Reduction of energy consumption
30 percent corresponds to a reduction from 14 MWh per SEK million in sales in 2013 to less than 10 MWh per SEK million in sales 2020. Consumption of purchased energy has remained at 11,3 (11,2) MWh per MSEK total sales during 2017.
Performed energy audits on production unit' s equals 74 percent.
NIBE target to phase out fuel oil burning from all our own properties and replace it with heat pumps or other fossil free technology has progressed. For 2017 year reporting, six companies where the Group own the building are still using light fuel oil, fully or as a compliment.
302-5 - Reduction in energy requirements of products and services
Product examples:
Heat-pumps: A ground-source heat pump can save up to 80% compared with a situation in which the building was heated with direct-acting electricity. Both economical and environmentally friendly.
Wood burning stoves: Our modern stoves have far lower wood consumption and emissions into the environment than older stoves.
A test carried out in 2016 by the Swedish Energy Agency showed that wood consumption can be reduced by around 20% and emissions into the environment halved or reduced by up to 85%. Most of the modern stoves tested have an efficiency of 75-80%, while the older stoves in the test are at 59-66%.
Eco-design directive is affecting end customer products. NIBE products have been upgraded to fulfill the eco-design directive or been obsolete.
303 Water use
103 - Generic Disclosures on Management Approach
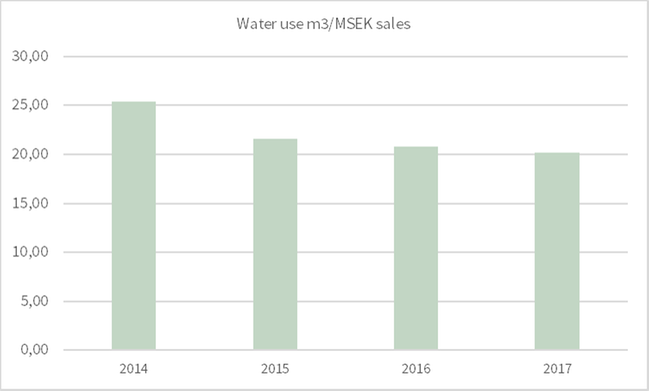
NIBE know that water scarcity is a global problem that is increasing. Today we use relatively small quantities of water and our production sites are located where there is access to water. However, the circumstances can change, and that is why we want to monitor our water use.
303-1 - Water withdrawal
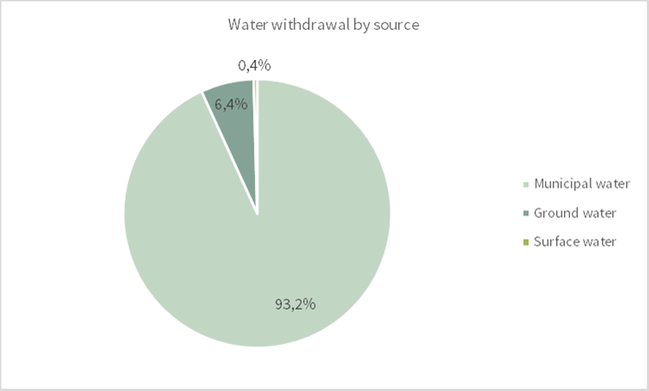
The main source of our used water, more than 90%, is municipal water. Water volumes are summarized from invoices or from flow meters at source.
Water withdrawal, cubic meters | Europe | North America | Asia and Australia |
|---|---|---|---|
Municipal water | 132 686 | 109 431 | 90 962 |
Surface water | 657 | 0 | 0 |
Collected rainwater | 0 | 0 | 0 |
Ground water | 22 571 | 0 | 1 000 |
Waste water from another organization | 0 | 0 | 0 |
Total per region | 155 914 | 109 431 | 91 962 |
The total water withdrawal was 357 307m2 during 2017
303-2 - Water sources significantly affected by withdrawal of water
No water sources are significantly affected.
303-3 - Percentage of total volume recycled
The water is mostly used as cooling water that is recirculated for a long time in a closed system. Process water is also recirculated to a large extent.
Work is ongoing to be able to calculate the recycled volumes. The result for 2017 is 14 percent recycled water. 6 out of 90 companies have reported recycled water (7%).
305 Emissions
103 - Generic Disclosures on Management Approach
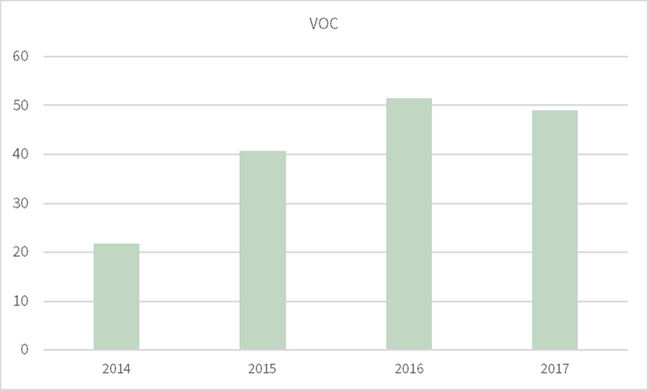
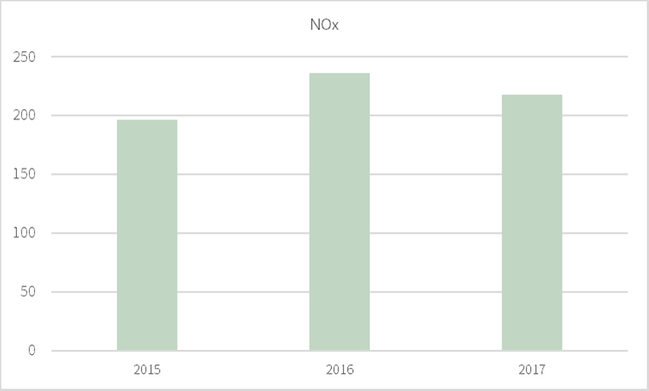
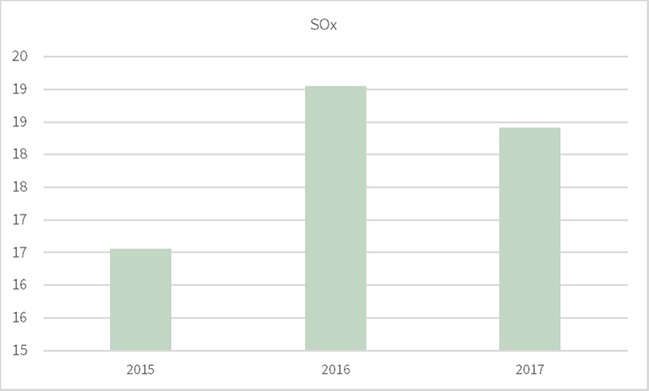
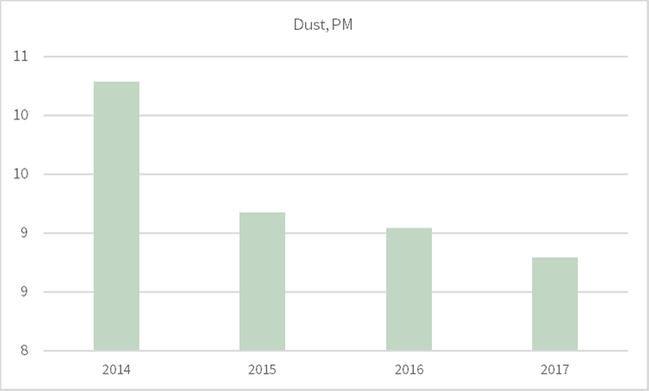
NIBE atmospheric emissions consist of GHG, NOx, SOx and VOC.
Besides generating GHG emissions from energy use, we also use refrigerants in our products and our own installations, which generate some diffuse emissions of refrigerants to the atmosphere.
Transportation is an area where we are developing the reporting of GHG emissions. Today we can track and report the GHG emissions from our own vehicles. We are beginning to get data for purchased transportation and business travel but do not have enough accurate data to be able to report it yet.
Depending on the type of production process, other types of emissions can be more or less material, but since some of the companies have atmospheric emissions as a significant environmental topic, we regard it as important for the whole NIBE Group and something that we should work to minimize.
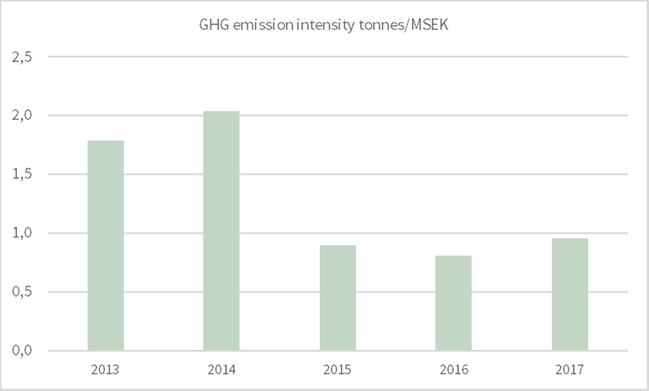
NIBE has an indirect target to reduce our GHG emission intensity. The target is expressed in terms of reducing energy use by 30% from 2013 to 2020 less than 10 MWh/MSEK total sales.
NIBE buy GoO:s that cover all purchased electricity, which means that it is generated from renewable sources. We have a target to phase out all fossil oil burning from our own facilities.
Our reported carbon emissions are calculated based on GHG protocol emission factors.
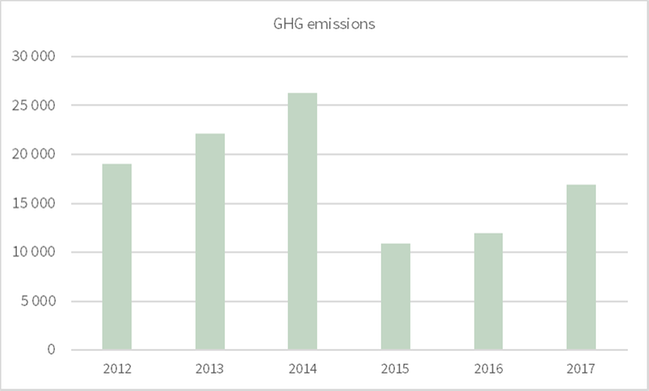
305-1 - Direct GHG emissions (Scope 1)
In 2017, carbon dioxide emissions from energy use in our own production plants generated 90 (88) percent of our total GHG emissions, or 16,900 (12,100) tons.
The total emissions from diesel and petrol amount to 5,300 (5,800) tons, an decrease of 500 tons on the previous year. Our ambition is to gradually switch to vehicles fueled by renewable energy.
305-2 - Indirect GHG emissions (Scope 2)
Purchased electricity is to 100 percent covered by GoO:s. Purchased heat and cooling amounted to 1614 tons.
305-3 - Other indirect GHG-emissions (Scope 3)
The reported GHG emissions from business travel was 2,102 tons. 24 companies out of 90 has been able to report GHG emissions from business travels (27%).
The reported GHG emissions from purchased transportation for incoming goods was 7,371 tons and from purchased transportation for outgoing goods was 17,819 tons.
305-4 - GHG emissions intensity
305-5 - Reduction of GHG emissions
The foremost reduction is due to the purchasing of green electricity certificates with guarantee of renewable origin.
305-6 - Emissions of ozone-depleting substances
Not reported.
305-7 - NOx, SOx and other significant air emissions
Not all operations have measurable air emissions, but all report what they measure. For NOx and SOx no data was available for 2014.
306 Effluents & Waste
103 - Effluents and Waste
Waste is an important topic for all our production companies and there are ongoing efforts to minimize waste generation as well as recycling more.
306-1 - Water discharge
Water discharge is considered material for a few of our production companies* from a monitoring perspective. We have chosen to ask all production companies to report their water discharge to be able to see trends and take action against negative changes. We are attempting to get data that are more reliable on water discharge.
Water discharge, cubic meters | Europe | North America | Asia and Australia | TOTAL |
|---|---|---|---|---|
To municipal water treatment plant | 144 797 | 39 902 | 60 595 | 245 294 |
To an adjacent water body | 7 204 | 0 | 46 000 | 53 204 |
To external treatment | 1268 | 0 | 500 | 1 768 |
To another organization for reuse | 0 | 0 | 0 | 0 |
Total per region | 153 269 | 39 902 | 107 095 | 300 266 |
Metal discharges to water, kg | Europe | North America | Asia and Australia | TOTAL |
|---|---|---|---|---|
Aluminum | 0 | 0 | 0 | 0 |
Copper | 0,062 | 3,86 | 0 | 3,921 |
Zinc | 0,555 | 2,505 | 0 | 3,06 |
Cadmium | 0,013 | 0,012 | 0 | 0,024 |
Lead | 0,2 | 0,022 | 0 | 0,223 |
Mercury | 0 | 0,002 | 0 | 0,002 |
Chromium | 0,061 | 0,012 | 0 | 0,002 |
Nickel | 0,111 | 0,016 | 0 | 0,127 |
Other metals | 1,49 | 0,01 | 0 | 1,502 |
Organics and nutrients to water, kg | Europe | North America | Asia and Australia | TOTAL |
|---|---|---|---|---|
Biochemical Oxygen Demand | 417 | 4 576 | 20 | 5014 |
Chemical Oxygen Demand | 2 442 | 8 519 | 40 | 11 001 |
Total Organic Carbon | 0 | 0 | 0 | 0 |
Oil and Grease | 0,02 | 599 | 0 | 599 |
Nitric nutrients | 208 | 0 | 2 | 210 |
Phosphoric nutrients | 23 | 18 | 0 | 41 |
Total solids | 3 090,02 | 13 712 | 62 | 16 864 |
306-2 - Waste by type and disposal method
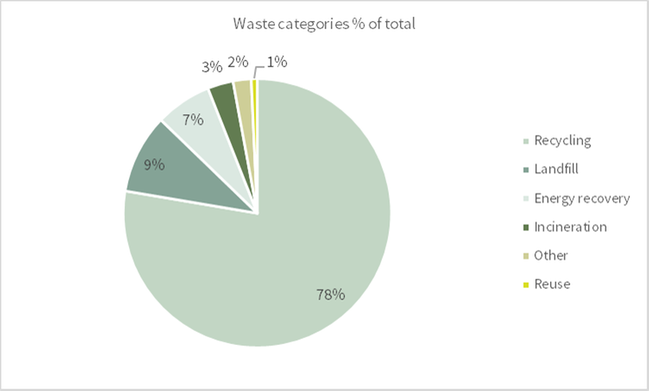
In 2017, we recycled 85 percent (85) of our waste, 11 percent (11) of which as energy recovery by means of incineration. A total of 17 390 (18 050) tons of waste were generated, 760 (1 680) tons of which were hazardous waste.
We sent 1 220 (1 360) tons to external landfill, which represents 7 percent of the total waste volume. This consists, for example, of process waste, which may contain contents of heavy metals that are too high for recycling or materials that cannot be incinerated, such as stone ceramics and composites.
Non-hazardous waste, kg | Europe | North America | Asia and Australia | TOTAL |
|---|---|---|---|---|
Reuse | 8 314 | 183 639 | 0 | 191 953 |
Recycling | 16 178 009 | 5 867 226 | 65 000 | 22 110 235 |
Recovery | 276 145 | 0 | 0 | 281 045 |
Energy recovery | 1 716 563 | 78 200 | 20 000 | 1 925 473 |
Incineration | 357 665 | 0 | 0 | 357 665 |
Landfill | 1 017 542 | 1 344 881 | 285 878 | 2 648 301 |
On-site storage | 3 100 | 20 485 | 0 | 23 585 |
Other destination | 122 713 | 25 124 | 55 590 | 203 427 |
Total | 19 680 051 | 7 519 555 | 426 468 | 28 070 941 |
Hazardous waste, kg | Europe | North America | Asia and Australia | TOTAL |
|---|---|---|---|---|
Reuse | 5 | 0 | 0 | 5 |
Recycling | 36 190 | 20 462 | 217 044 | 273 696 |
Recovery | 12 119 | 0 | 0 | 12 119 |
Energy recovery | 20 969 | 19 461 | 10 101 | 50 531 |
Incineration | 120 780 | 384 436 | 41 318 | 546 534 |
Landfill | 73 197 | 27 216 | 26 701 | 127 114 |
On-site storage | 3 001 | 569 | 0 | 3 570 |
Other destination | 388 508 | 43 020 | 1 960 | 433 488 |
Total | 654 769 | 495 164 | 297 124 | 1 464 618 |
306-3 - Number and volume of significant spills
No significant spills were reported during 2017.
306-4 - Transport of hazardous waste
Not reported.
306-5 - Water bodies affected by water discharges and/or runoff
Not reported.
307 Environmental compliance
103 - Generic disclosures on Management Approach
Legal compliance is considered one of the most important topics as NIBE cannot operate otherwise. All our production facilities shall have environmental management systems in place, and if there are more than 10 employees, the system shall be certified according to ISO 14001. The systematic approach, control systems and regular monitoring of environmental performance makes it possible to be proactive and comply with environmental legislation.
Environmental grievance mechanisms are part of NIBE environmental responsibility and our stakeholder dialogue. We take all complaints seriously and strive to prevent reoccurrence of any event that might have caused a complaint. Evaluation of the effectiveness of the grievance mechanism is done locally within the framework of each company's environmental management system. Complaints are also reported at Group level. Should there be an unreasonable quantity of complaints, or repeated complaints about the same issue, there would be cause for an investigation and a site visit from Group sustainability. All operations have local grievance mechanisms where neighbors can contact a responsible person that will file their complaint and make sure it is handled correctly.
307-1 - Non-compliance with environmental laws and regulations
In 2017, two incidences of environmental limits being exceeded were reported and measures were taken.
308 Environmental supplier assessments
103 - Generic Disclosures on Management Approach
NIBE expect the suppliers to follow the same principles concerning precaution and environmental responsibility as we do, and therefore we evaluate suppliers on their environmental performance. We still need to increase the number of environmental evaluations and work is ongoing to introduce our common tool to support the purchasing departments to carry out evaluations in a less time consuming but still effective manner. NIBE target is that all sites will use the new tool by 2020 and that 100 percent of our new suppliers of direct materials are evaluated accordingly before onboarding.
308-1 - Percentage of new suppliers that were screened using environmental criteria
Of our new suppliers of direct material, 26 (12) percent were evaluated on environmental performance. That is a large increase compared to 2016.
308-2 - Significant actual and potential negative environmental impacts in the supply chain and actions taken
Not reported.