GRI-Appendix
405 Diversity and equal opportunity
103 - Generic Disclosures on Management Approach
Diversity and equal opportunity are part of NIBE's core values and our commitment to respect human rights. That commitment applies to all levels and all companies within the NIBE Group. Regardless of language, ethnicity, gender, age or background, everyone deserves respect and the same opportunities without any form of discrimination. We strive to work in a way that guarantees tolerance to differences and gives everyone the same opportunities for development, training and careers.
Equal salary for equal job between men and women is a basic part of non-discriminative practices. According to our increased focus on fairness and equality, we include equal remuneration, according to our policy, as a topic for discussion in connection with company visits.
A new Diversity and Equal treatment policy was published in the Group during 2017. All companies will implement this policy during 2018.
405-1 - Composition of governance bodies and other indicators of diversity
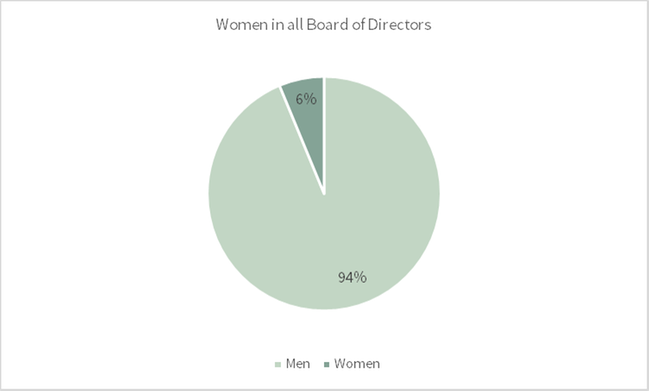
The Board of Directors for NIBE Group consists of four men and two women. Their ages are between 57 and 66, with an average of 62.2. All are of Swedish nationality.
The three business areas have informal boards of directors at BA level and formal boards at the different company levels, as some of the subsidiaries also have subsidiaries.
Gender equality, number | Europe | North America | Asia and Australia | Group |
|---|---|---|---|---|
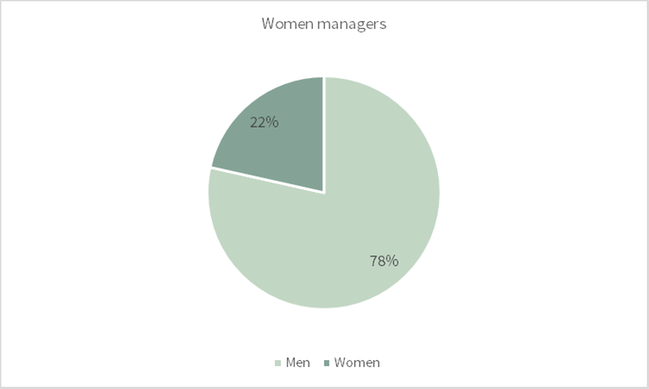
Women in managerial position | 83 | 95 | 37 | 215 |
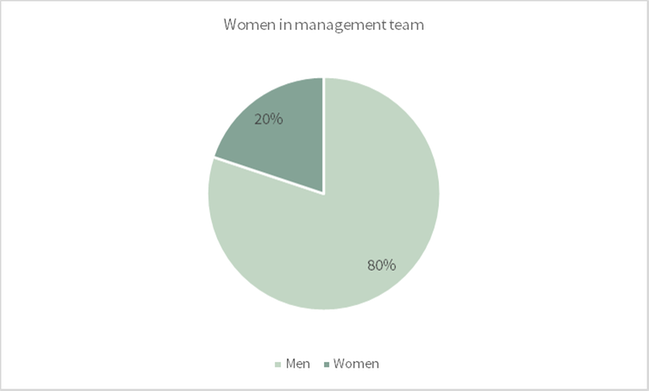
Women in local management teams | 51 | 55 | 15 | 121 |
Women in Boards of directors | 9 | 6 | 0 | 15 |
Age distribution, number of employees | Europe | North America | Asia and Australia | Group |
|---|---|---|---|---|
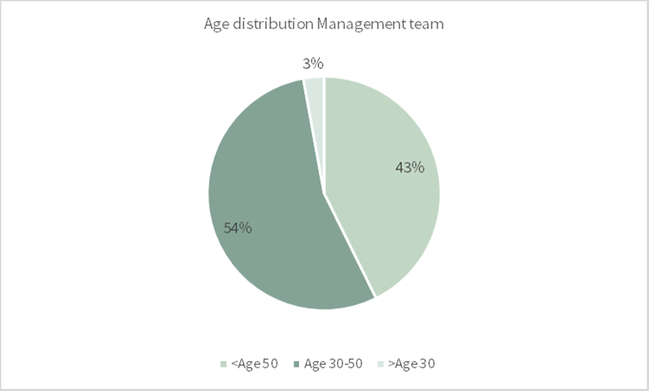
Management team members age over 50 | 150 | 93 | 10 | 252 |
Management team members age 30-50 | 158 | 115 | 50 | 253 |
Management team members age under 30 | 7 | 9 | 1 | 17 |
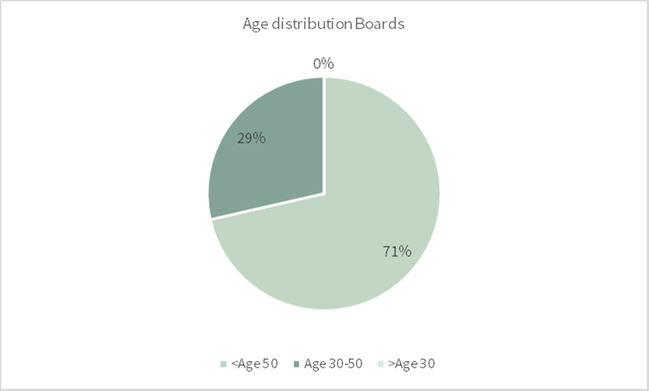
Board members age over 50 | 111 | 94 | 5 | 210 |
Board members age 30-50 | 72 | 9 | 3 | 84 |
Board members age under 30 | 0 | 0 | 0 | 0 |
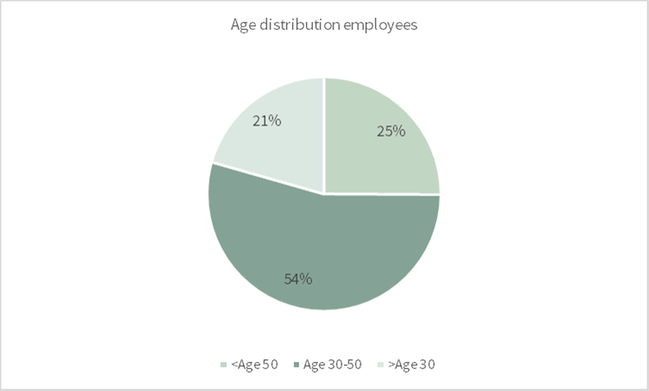
Number of employees age over 50 | 2 100 | 1 197 | 60 | 3 357 |
Number of employees age 30-50 | 3 911 | 2 586 | 774 | 7 271 |
Number of employees age under 30 | 1 307 | 1 174 | 276 | 2 757 |
405-2 - Ration of basic salary and remuneration of men to women
Not reported.
